It has been a consistent cycle for Intel in the past decades with the release of their products and its really unusual for me to review a CPU entry in a generation that has appeared a year earlier. We’ve already covered Intel’s Tiger Lake low-power CPU and for the most part, they excel in their goals providing excellent battery life and performance-per-watt especially in their slim bodies. Based on the Willow Cove uarch, Intel’s 10nm SuperFin part ramps up the enthusiast offering with the Tiger Lake H CPUs, Intel’s true 10nm enthusiasts parts with a nominal TDP target of 45w offering fairly competitive performance to AMD’s Ryzen mobile CPU whose popularity has been giving much equity as the global CPU shortage makes Ryzen laptops particularly sparse in the current market keeping the market open to what Intel has to offer.
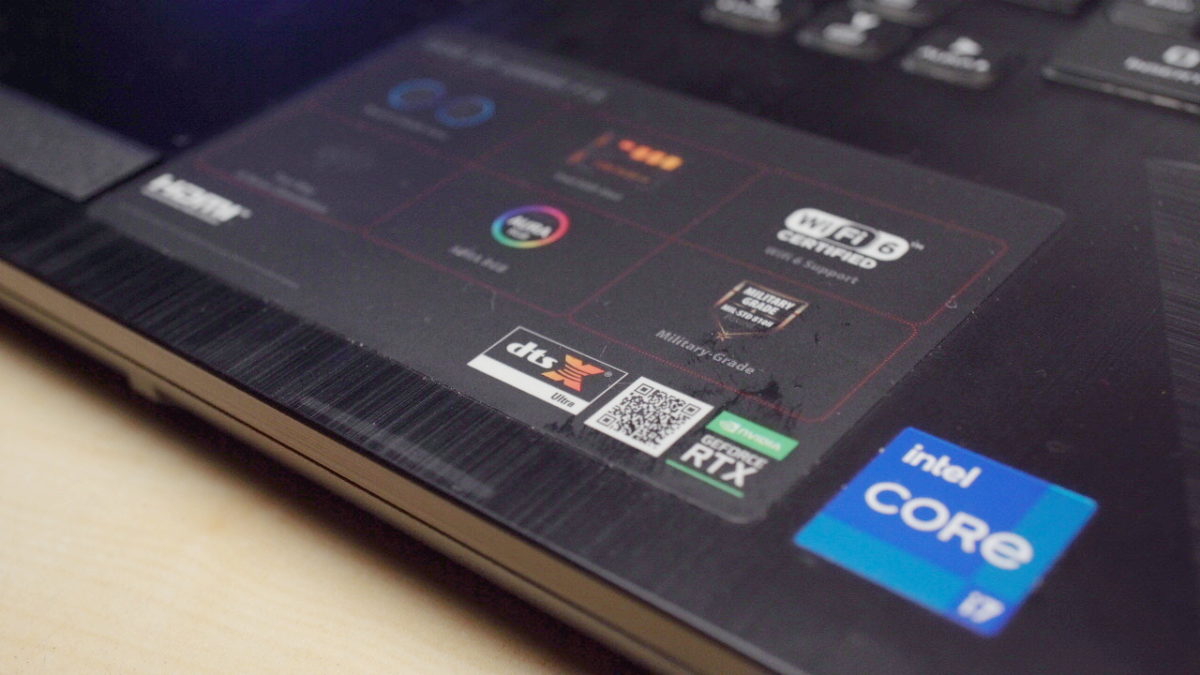
Tiger Lake brings with it a new microarchitecture from Intel, a much awaited departure from the Skylake derivatives and refinements we’ve seen for the last half-decade and it comes in at critical point where people are driven to go digital. Tiger lake brings with Xe graphics as well as Thunderbolt 4 (while also key to the performance of these machines but we won’t touch on much for this article) there’s also PCIe Gen4 support.
The Tiger Lake-H Series Product Stack
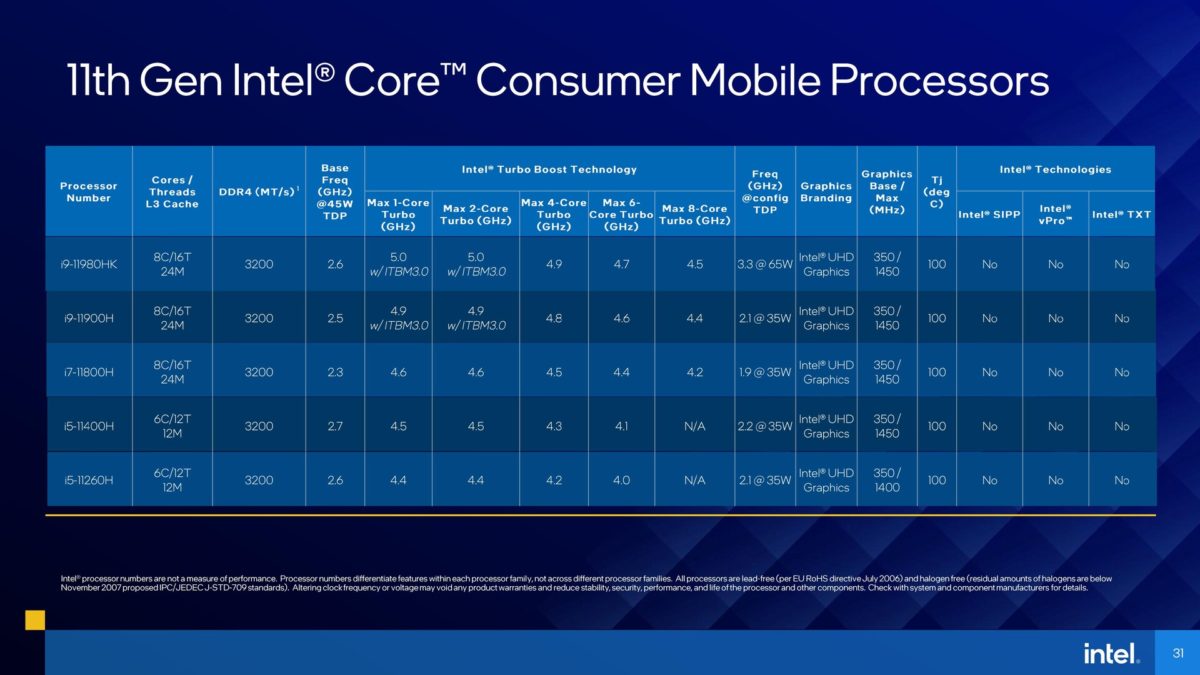
Tiger Lake-H will include some key enthusiast SKUs including the top-end flagship Core i9-11980HK, followed by the i9-11900H and the one we have for review today, the Core i7-11800. Those make up the 8-core parts for Tiger Lake H and is rounded out by the 6-core Core i5-11400H and the Core i5-11260H. As you may have noticed, the Core i9 models are still 8-core models but boast Turbo Boost Max 3.0, much like their desktop counterpart’s Turbo Velocity Boost, ITBM3.0 provides the Core i9 models of the Tiger Lake CPU family a significantly high core clock under light, single threaded workloads.
OEM partners can design CPUs within Intel’s 35-45W power design spec and this will influence how each CPU behaves. For specifics on that, we’ll have to cover more designs and we’ll discuss that in detail in our upcoming review of the MSI GE76 Raider featuring a Core i9 Tiger Lake H CPU.
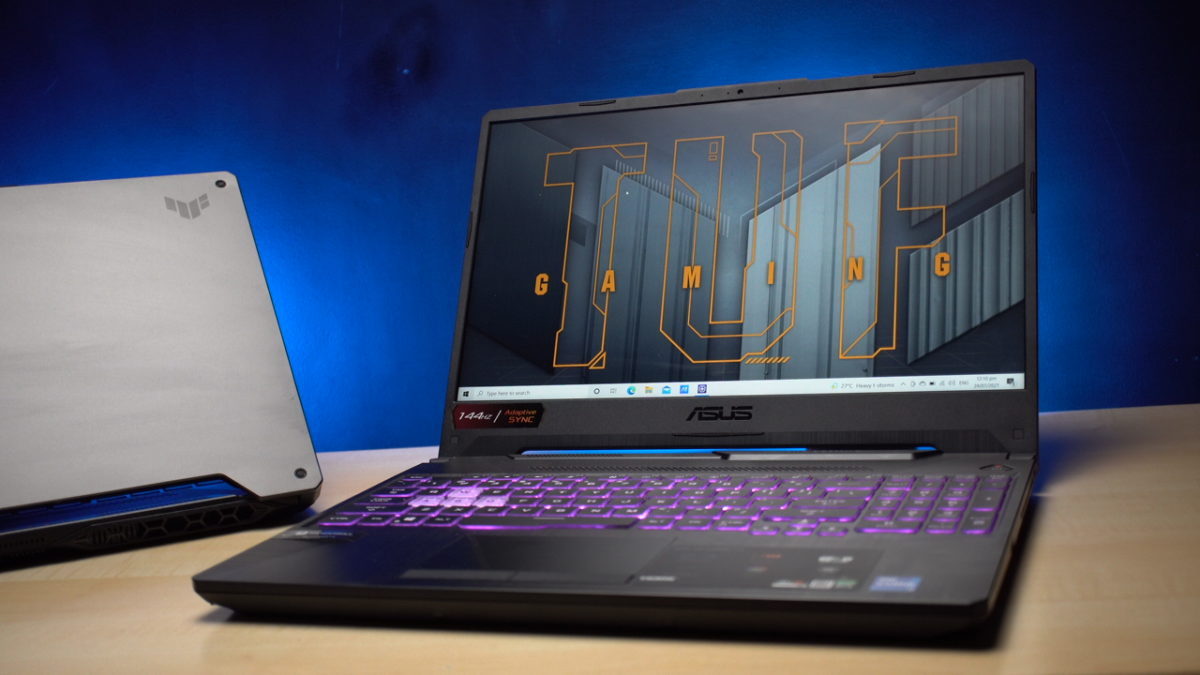
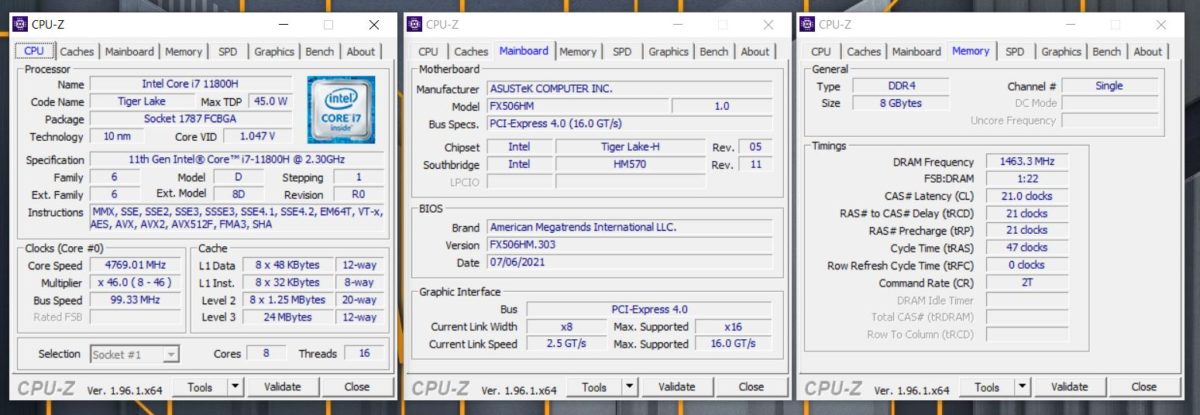
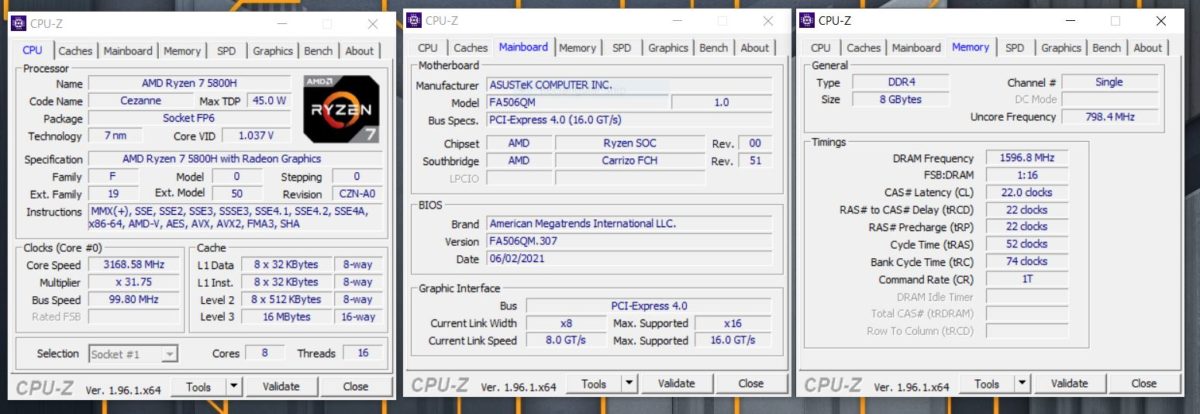
For this review we’ll be using the ASUS TUF Gaming F15 (FX506HM) and our comparative system will be the equivalent AMD unit, the ASUS TUF FA506QM which rocks an AMD Ryzen 7 5800H, a fair comparison I would say. The ASUS TUF F15 retail price is ₱79,995 and is now available at Abenson, Electroworld, Gigahertz, Lazada, Octagon, PC Express, Silicon Valley and Villman.
The rest of the specs are filled out with memory configurations at 8GB DDR4-3200 (1Rx16) and a 1TB SSD.
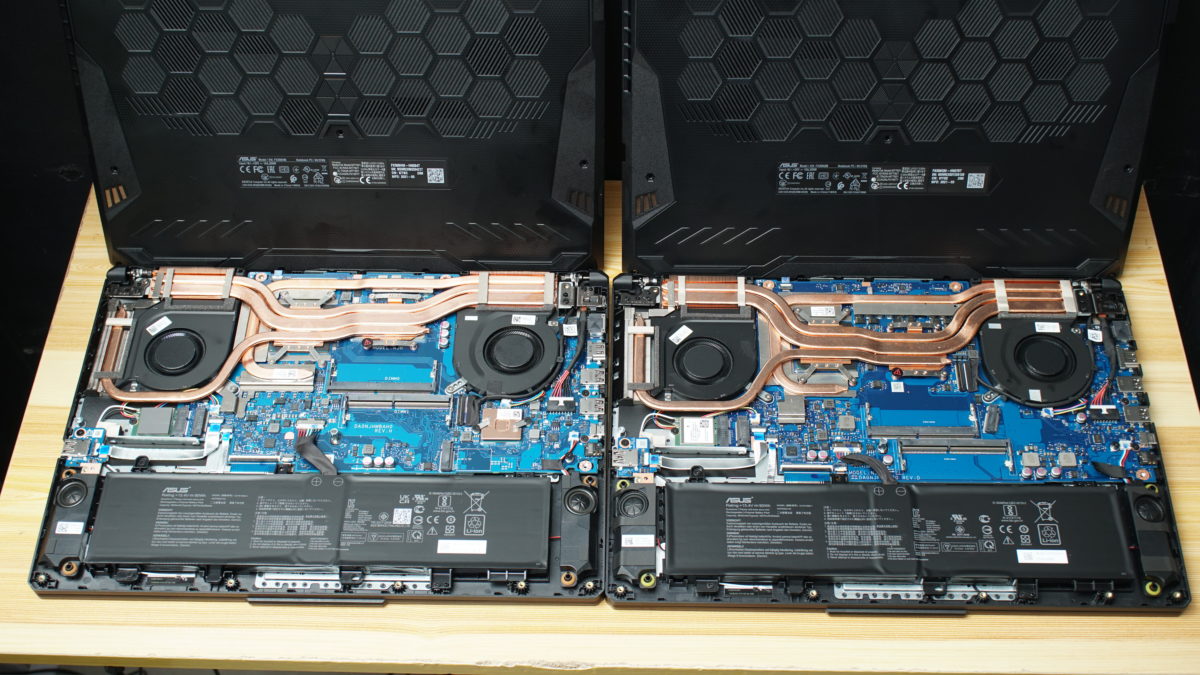
Here is a shot of the internals of the laptop. I mentioned that differences in designs can influences performance and I’m sharing these images to show that to my knowledge, the cooling solution should be equal on these laptops.
Test Setup & Methodology
Our laptop testing methodology for laptops combines most of our component workflows for CPUs, graphics cards and monitors. You can find out more how we benchmark GPUs in this update for last year.
We’ve added some new benchmarks in our CPU test list but we are in the process of adding more and are trying out more benchmarks that reflect a more modern system’s general usage scenario tailored for our audience.
CPU Tests
- Arithmetic Test
- SuperPI 32M(Single-Threaded)
- wPrime (Multi-threaded)
- Rendering Test
- Blender 3D
- Cinebench R20
- Cinebench R23
- POV-Ray
- CoronaRender
- V-ray 4
- Encoding Test
- 7zip
- Memory Test
- AIDA64 Memory Benchmark
- Content Creation Test
- PugetBenchmark for Photoshop
- PugetBenchmark for Premiere Pro
- Productivity Test
- Microsoft Office Word
- Microsoft Office Excel
- Microsoft Office PowerPoint
- Synthetic Gaming Test
- 3DMark Time Spy
- 3DMark Fire Strike
- System Test
- BAPCo SysMark 25
Gaming Test
- Counter-Strike Global Offensive (DirectX 9)
- DOTA 2 (DirectX 11)
- Rainbow Six Siege (DirectX 11)
- The Witcher 3: Wild Hunt (DirectX 11)
- Shadow of the Tomb Raider (DirectX 12)
- Apex Legends (DirectX 11)
- Valorant (DirectX 11)
- PlayerUnknown’s Battlegrounds (PUBG) (DirectX11)
- Cyberpunk 2077 (DirectX 12)
All games tested on 720p and 1080p
Thermal Behavior and Power Usage
We start off our test by taking a look at how the ASUS TUF GAMING 2021 design utilizes our CPUs. This will give us a good foundation of how it would behave especially in multi-threaded workloads.

Using Cinebench R23 as our stress test, we load up the 30-minute test on the system with few minutes of idle time to show you our idle temperature and clock speeds. This chart shows the direct correlated temperatures to the clock speed when a certain load is applied, in this case a multi-threaded workload. Take note that Cineebench R23 does not use AVX-512.
In idle, we have both the Intel Core i7-11800H and the Ryzen 7 5800H hovering around 4.5Ghz with Intel dipping between 4Ghz to 4.6Ghz while temperatures see Intel dipping at 35*C and AMD settling at close to 39*C. Once loaded, Intel sits at 3.9Ghz while AMD does a more stable 4Ghz. You’ll notice AMD’s frequency eventually peaking earlier in the benchmark while we go through, this is the point where the benchmark cycles and with more cycles done, means its finishing work faster. This has been always been the strength of Ryzen but Intel doesn’t lag far as it remains close despite its lower load clock speed.
Temperatures at load are fairly toasty with AMD floating above 90*C whilst the Core i7-11800H sits at 88*C in a 28*C ambient room.

Looking at the power draw the CPUs are pulling during load, we can see the Intel is pulling a bit less than the Ryzen CPU. We’re not sure who is the one responsible for letting the CPU clock a bit less despite similar Turbo profile settings but it can be assumed that clock-for-clock, Intel could’ve matched a bit more evenly in this test if the laptop pushed 100Mhz faster for bit more juice as temperature show we can definitely afford the extra bump.
Anyway, this info will come in handy later when we discuss battery life.
CPU Performance Testing
Arithmetic, Rendering, Encoding
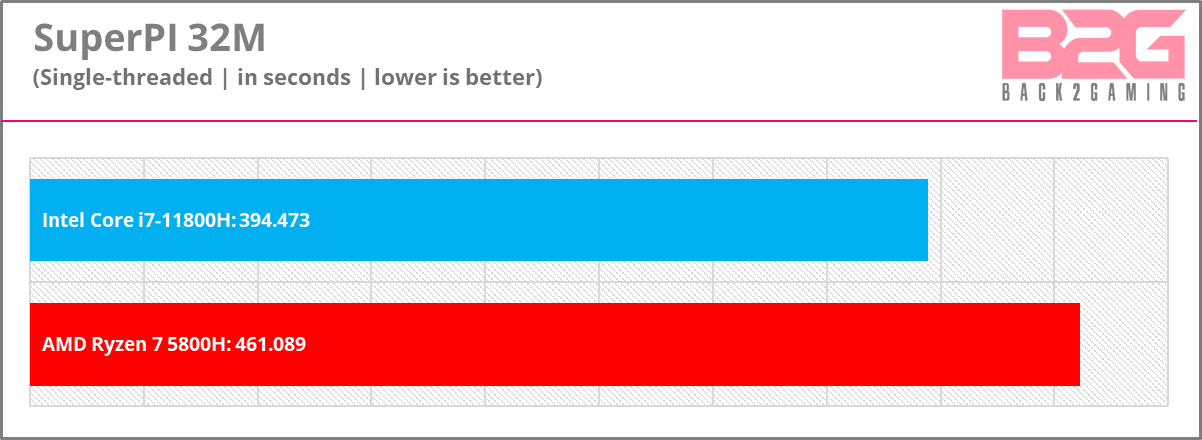
SuperPI is a long-standing benchmark and is popular in the overclocking scene. As a single-threaded application, it calculates the value of Pi to a very large of digits, specifically 32 million for this benchmark. Gives a good idea how fast in math a single thread of a CPU is.
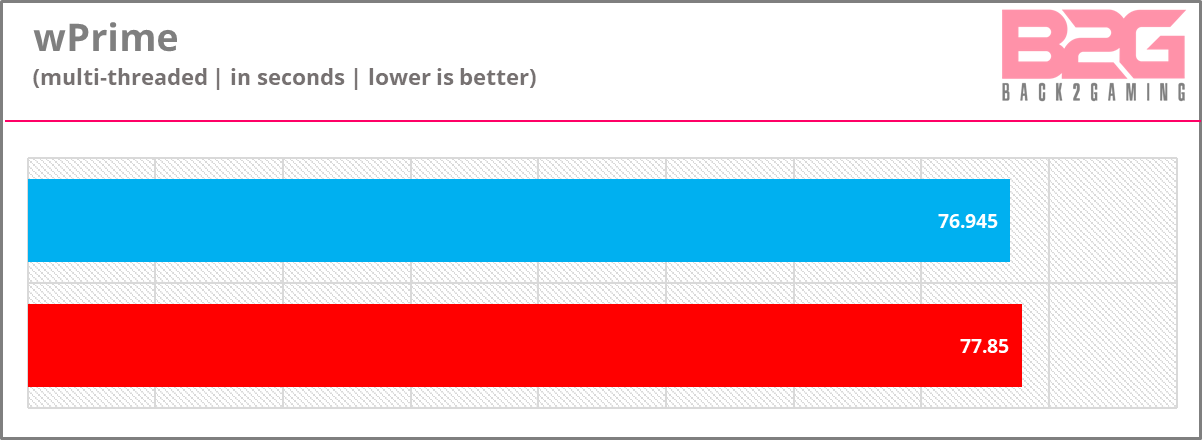
wPrime is another math benchmark designed to find prime numbers. This multi-threaded benchmark is designed to use up multiple CPU threads to perform its testing operations.
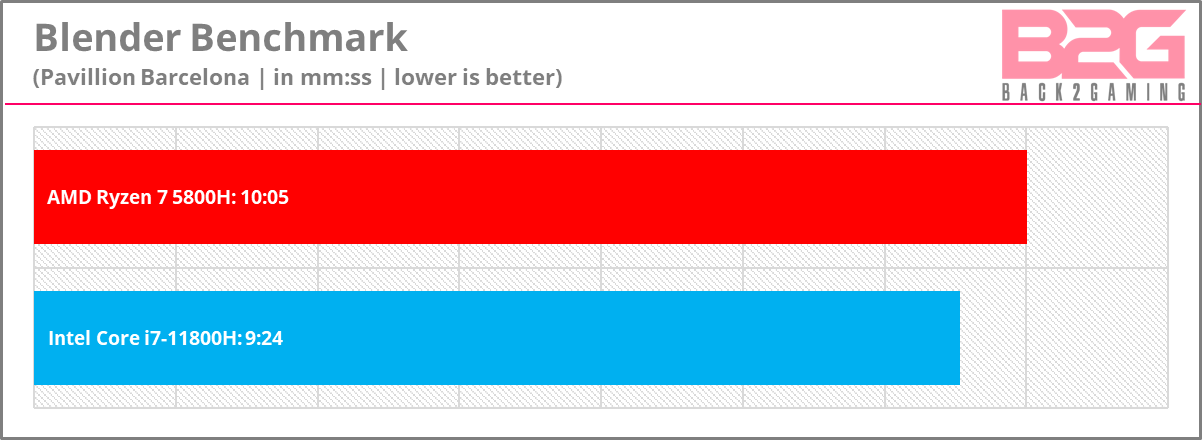
Blender’s Open Data project allows users to publish their own benchmarks so that the Blender project can create a reference guide for users on various systems and generate expected performance. We use the Barcelona Pavilion benchmark running on the CPUs for this test.
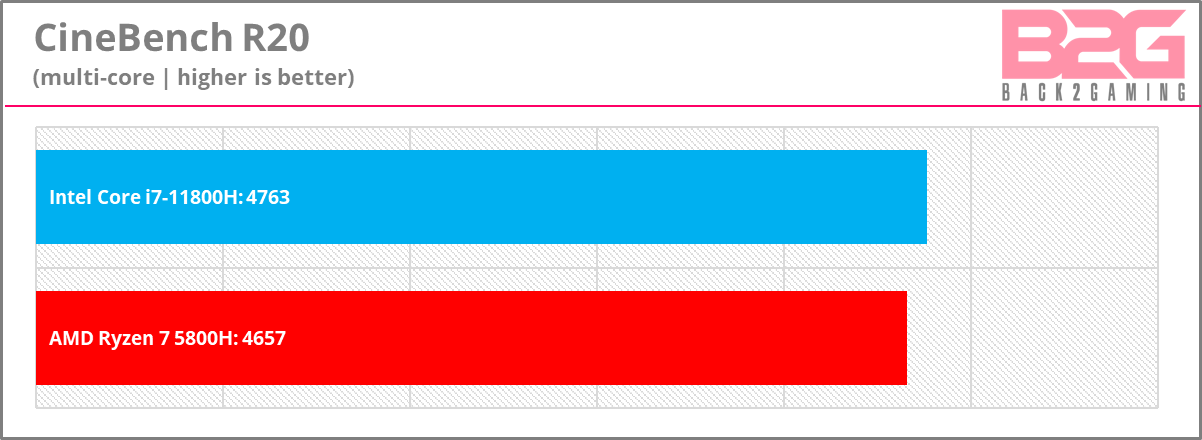
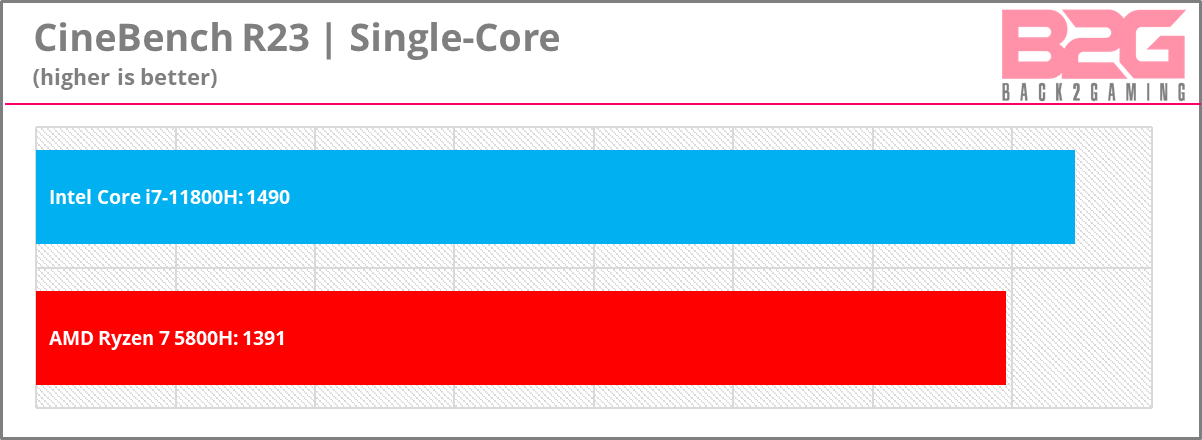
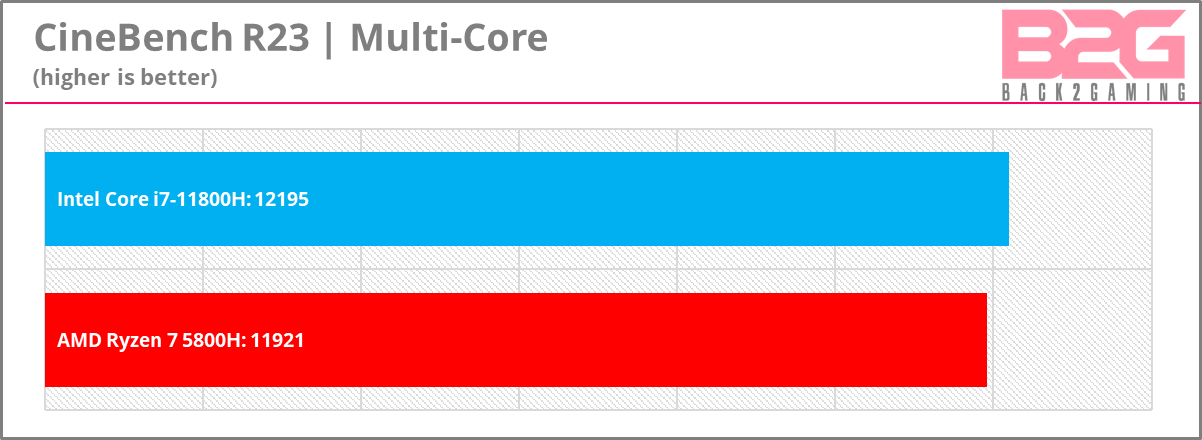
Cinebench R20 and R23 are Maxon Cinema 4D‘s benchmarking component and is available freely for download for everyone. These benchmarks are popular CPU rendering benchmarks and creates a taxing workload as it renders a single 3D image. R23 introduces a stress test mode as well for stability and throttle testing.
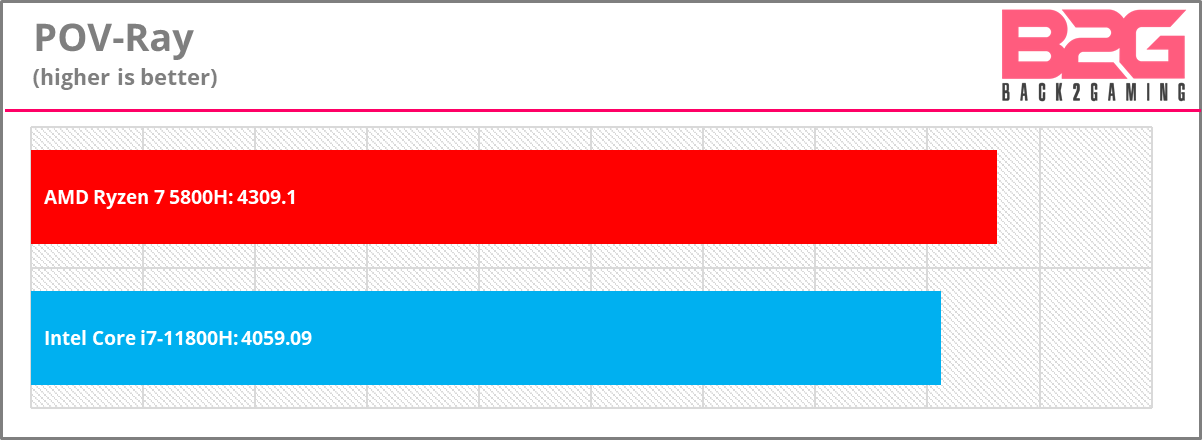
POV-Ray is another long-existing benchmark which is a raytracer. With raytracing being more commonly heard right now, the the heavily-taxing nature of raytracing during rendering is still a good benchmark to measure CPU performance and POV-Ray is a good example of that.
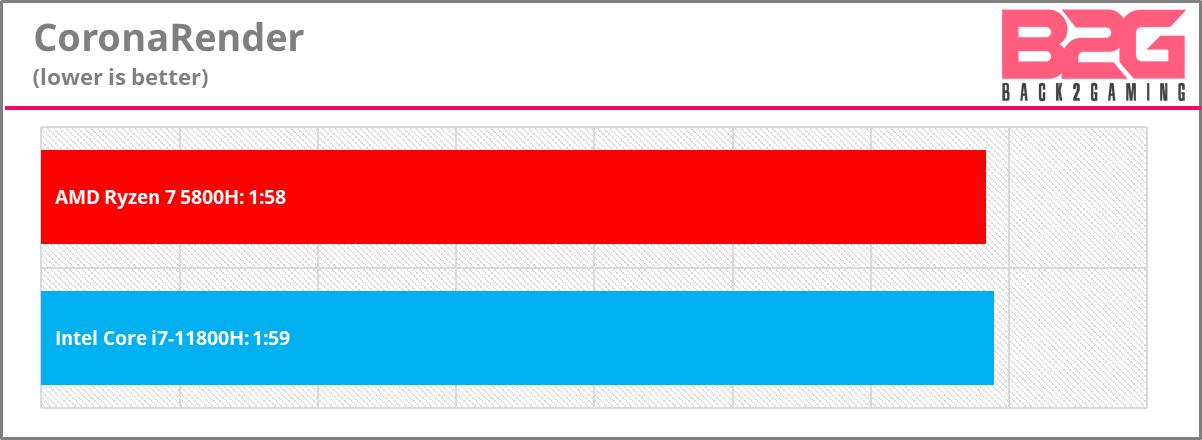
Just like CineBench, Corona is another rendering benchmark for a static scene and leverages CPU capabilities.
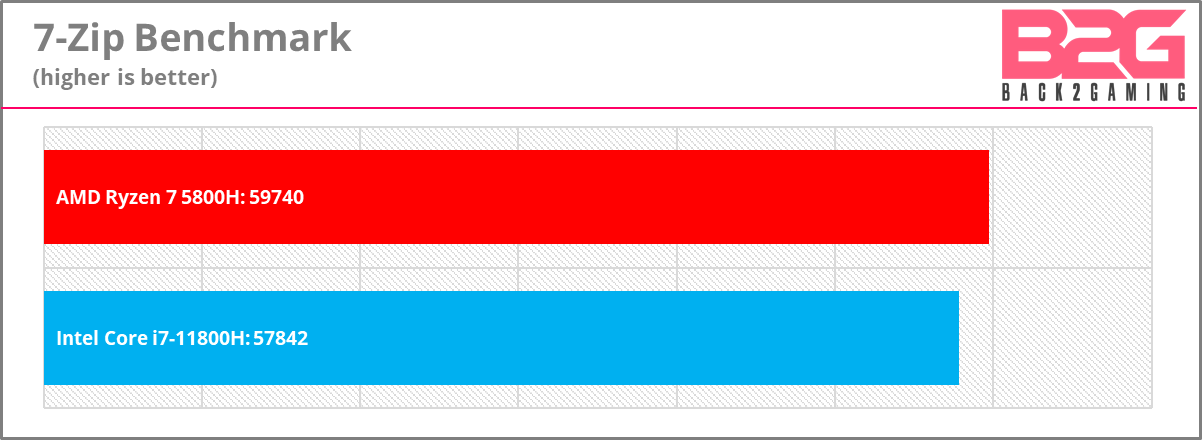
7-zip benchmark is a compression and decompression benchmark and outputs its results in millions of instructions per second or MIPS. The better the system, the higher the score but is primarily influenced by the CPU and RAM.
CPU Test: Content Creation
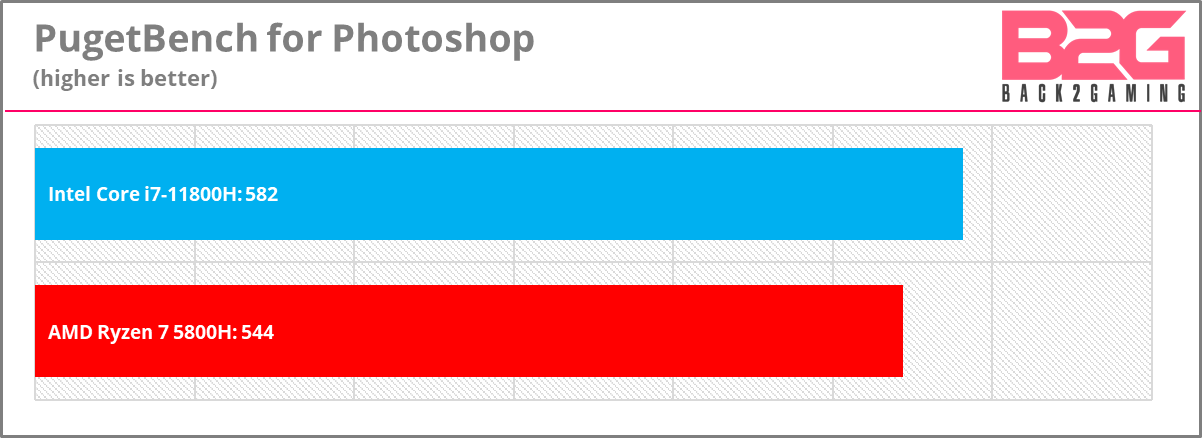
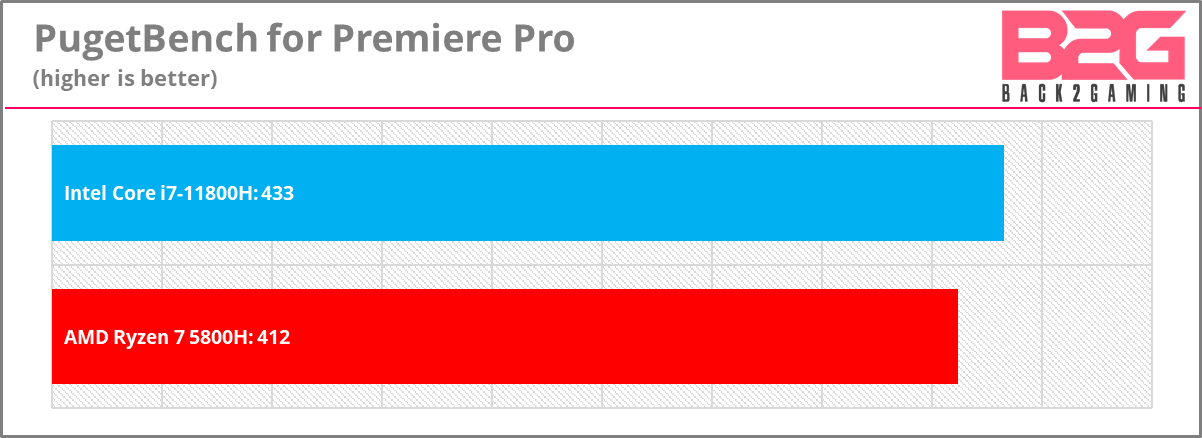
PugetBench is a collection of benchmarks designed to gauge the performance of workstations and is made by boutique PC builder, Puget Systems. The benchmark measures various operations of the the applications and scores them. Photoshop benchmark measures plenty of the application’s commonly used function and Premiere Pro is tested on its editing and rendering as well effects application performance. The smoother the experience and faster the render, the better the score. This is a system benchmark and many factors affect each individual benchmark.
This Photoshop benchmark is calibrated against a desktop 9900K while the Premiere Pro is with a Ryzen 9 5900X. You can find out more in their website linked above.
CPU Test: Productivity
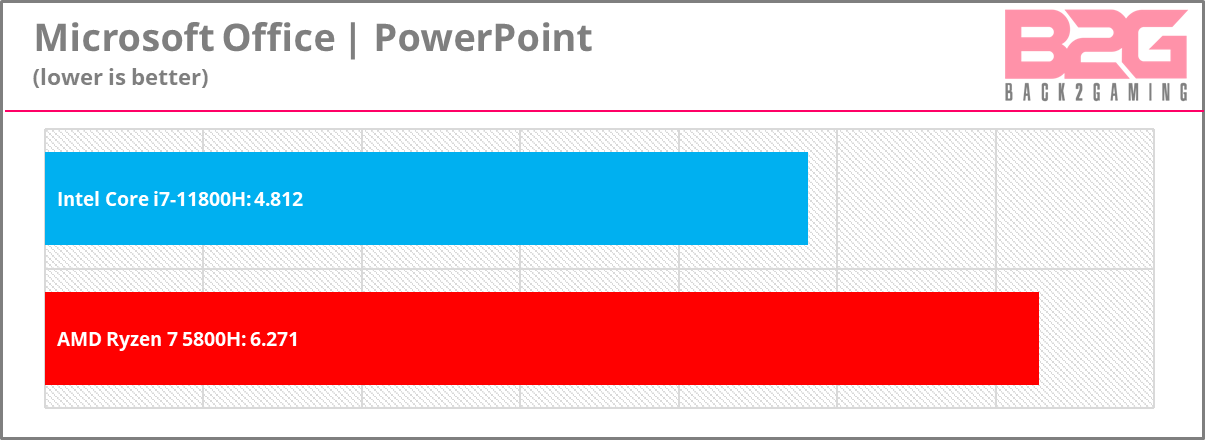
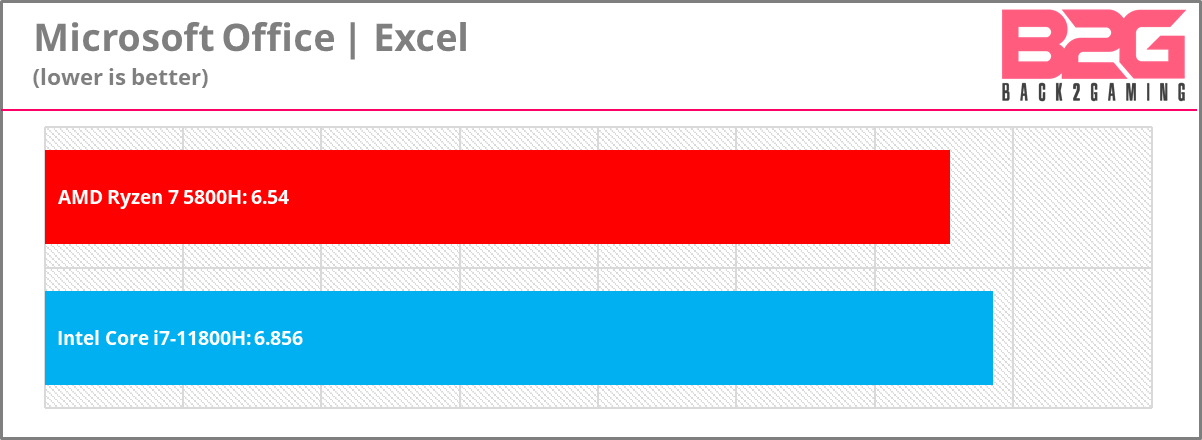
Microsoft Office is one of the most ubiquitous software in the world and people take it for granted. Our testing will cover typical performance from file opening, copy images, moving data, and various other tasks. This is done on a very sizable project for each application and the total time to complete the overall operation is presented for Word, Excel and PowerPoint.
System Test: BAPCO SysMark 25
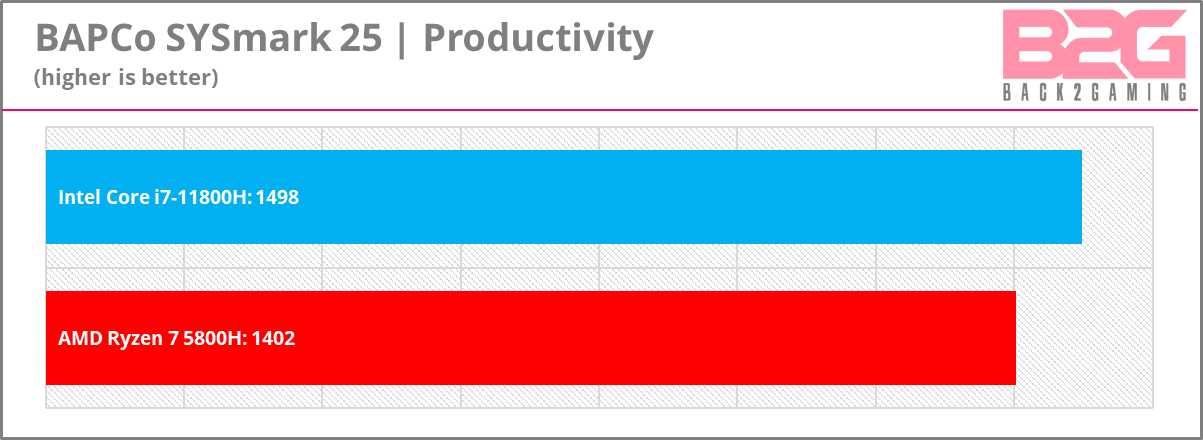
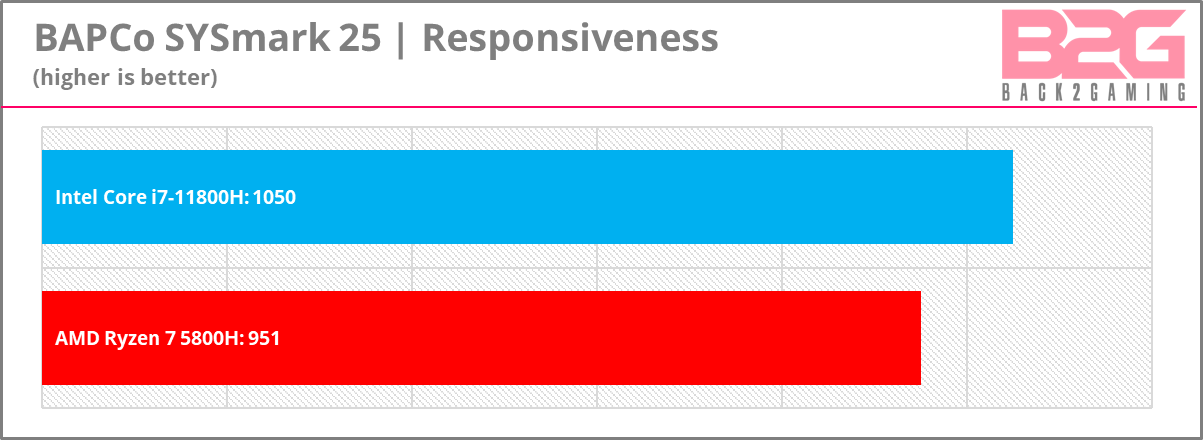
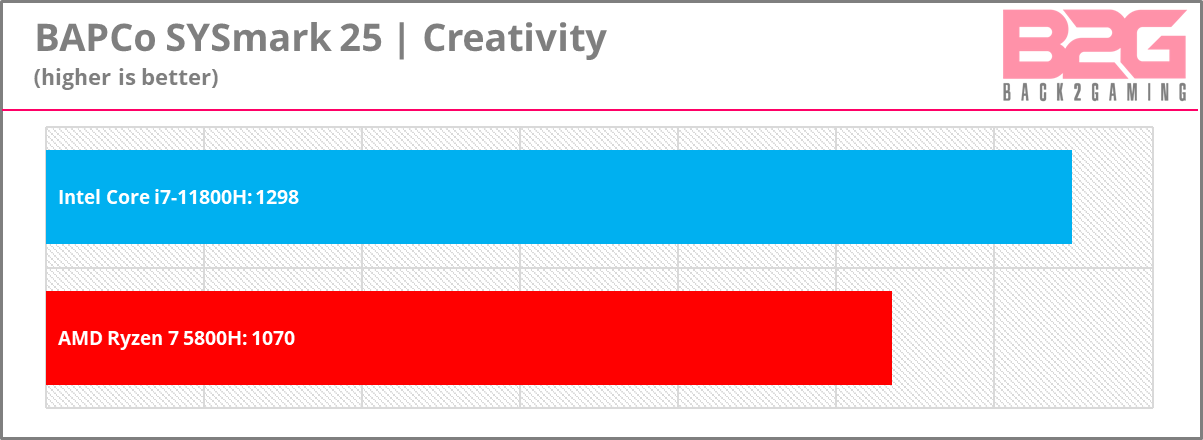
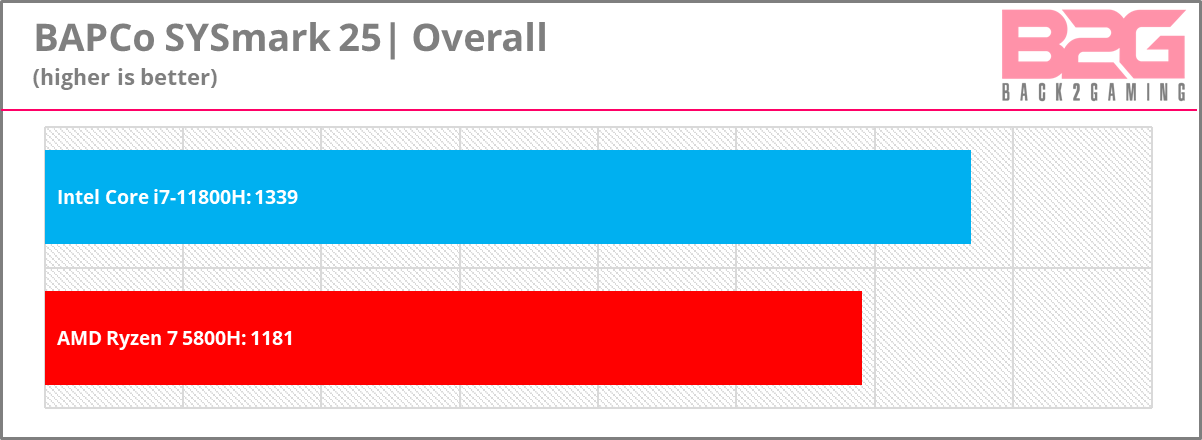
SysMark 25 is a benchmark that uses actual applications to gauge system performance. It has its own version of Microsoft Office and Adobe applications amongst other things to show how a system performs with those applications in mind. This is a benchmark intended for productivity testing with scores broken down in terms of a system’s productivity score, creativity score and responsiveness, which gives a measure of how quickly the system reacts when performing operations.
The benchmark compares the overall performance against a 6-core/6-thread system with 8GB of memory and 256GB of SSD storage with the base score being 1000. A system that scores 1500 is effectively performing 1.5x the calibration system.
Syntethic Gaming
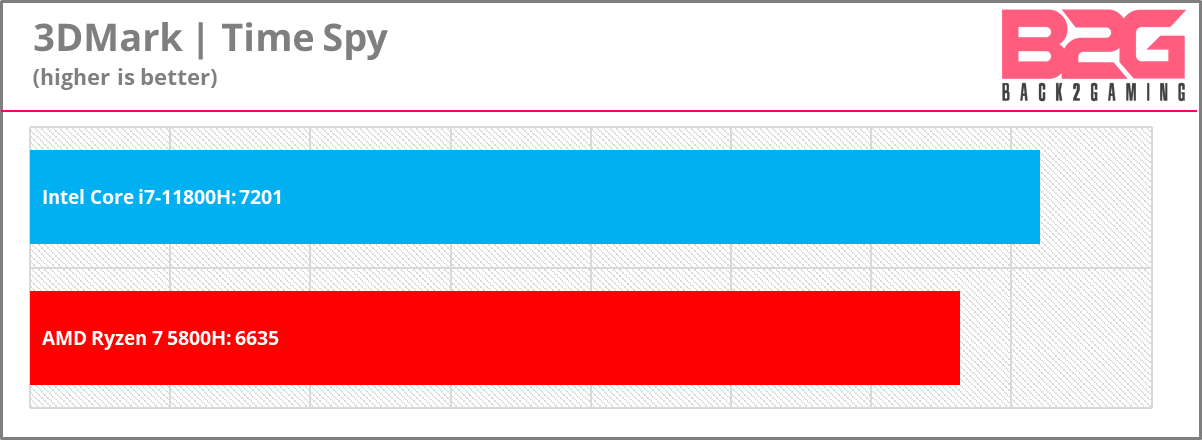
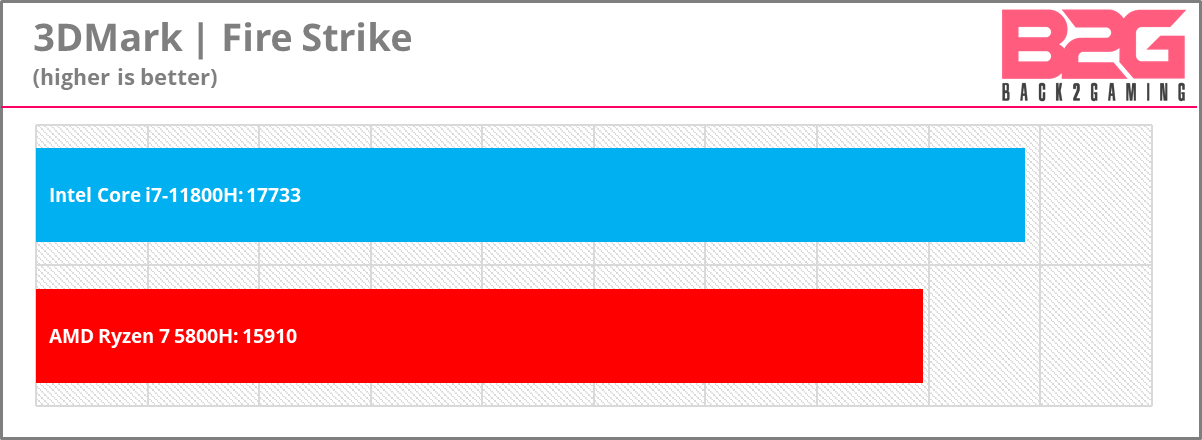
UL Benchmark is a popular way to showcase the theoretical gaming performance of a system with its very uniform testing scenes. They have a global database that pools these data and allows you to gauge if your system is operating as expected or not. While it is GPU-intensive, the total score will also be influenced by your CPU.
Looking good for Intel on synthetic testing but do some actual testing. Before we dive right in, I’ll refer your to one of our recent tests for my GPU testing methodology. You can also see our most recent update on how we measure graphics card performance in this article.
Gaming Performance (720p)
Testing games in 720p is a theoretical test to induce a CPU-limited scenario by pumping frames and giving us a good image of how a CPU would perform once it reaches these numbers. A system incapable of handling 720p numbers would theoretically not be able to attain anything higher with the resolution cranked up. That said, this serves as a purely artificial testing scenario especially for this review’s particular tier.

Gaming Performance (1080p)
This is the native resolution of our laptop and what most people would refer to as real-world performance. As we’ve been in 720p already, we’re not really hitting the CPU hard enough to cause any significant gap in performance and the NVIDIA RTX 3060 used by both systems is very close overall performance.

As expected from CSGO, one of the lightest games in our test, benefits nicely with the Core i7-11800H, this may be due to the game just being better a less cores which lets Intel do its boost more frequently with CSGO but whatever it is, the overall results for an RTX 3060 just shows we”re not going to get much more even if we step up to a faster CPU. That said, an RTX 3070 for or RTX 3080 for laptop would be a better comparison and we have just that for both Intel and AMD again so stay tuned and follow us on social media to see when we release our MSI GE76 Raider review.
Conclusion
Watch our summary review of the Intel Core i7-11800H below:
Before we close, let’s talk about battery life first: with all the wins that Intel has shown us in this showdown, as a laptop CPU, for a good portion of the userbase, a majority of which would great plugged-in performance but also dependable battery life. So this is where gets really challenging for Intel.
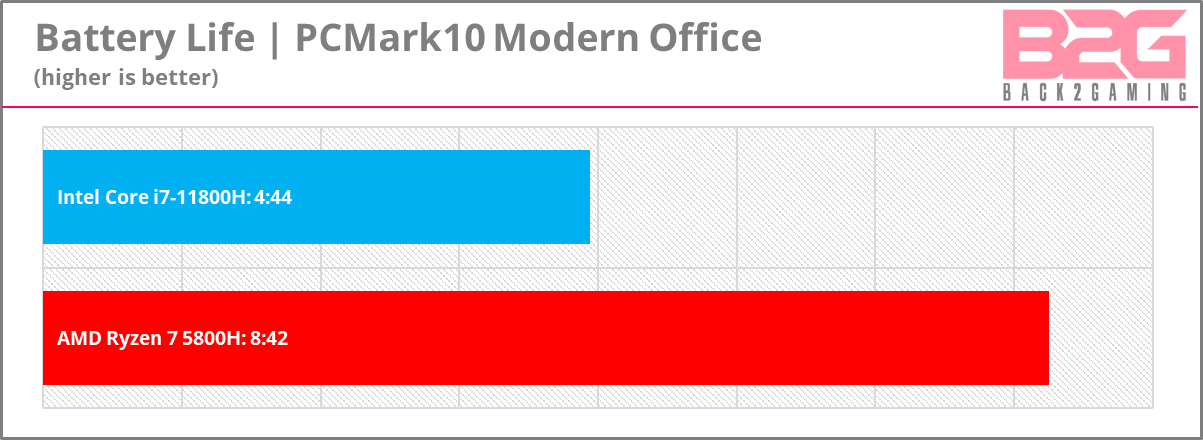
PCMark10’s Modern Office battery test runs a suite of software that reflects an typical office workload: browsing the internet, teleconferencing, word processing, spreadsheet, etc. and cycles through all of those until the battery runs flat. In our tests, we Intel doing only 4 hours and 44 minutes versus AMD’s 8 hours and 42 minutes. This contradicts the lower clocks and power draw we saw under Cinebench workload but it is possible that since PCMark 10 uses light workloads, Intel’s PL2 kicks in more frequently, hitting the Core i7-11800H at 100+ watts instead of 45 watts. This in itself is Intel’s weakness in this case as their dependence on higher clocks to gain higher single core performance is at the cost of more power.
We’ll take a closer look at this with a clock-for-clock comparison in a future article. For now, based on this design, its not a clear cut win but Intel can still ride out the year knowing their 10nm SuperFin CPU can fend off Ryzen just for a little bit more until Intel manages to resolve their productions woes and return to industry-leading form.
Focusing on the product itself, the Intel Core i7-11800H proves its a competent CPU in nearly all tests. Intel also makes the deal sweeter by adding Thunderbolt4 support and PCIe Gen4 as well faster memory at DDR4-3200. While all this changes only gives it a slight edge, it does suffer from battery concerns as well as heat management issue especially when an OEM partner decides it wants to take that full power limit to the extreme. In more specific-use cases though, mobile desktop replacements for use with video editing in mind especially on-site work where the intention is to be kept plugged-in for top performance, then the Core i7-11700H works just as well so anyone right now being coerced in reviews and social media to get a Ryzen for work can rest easy they can do their work on an Intel machine.
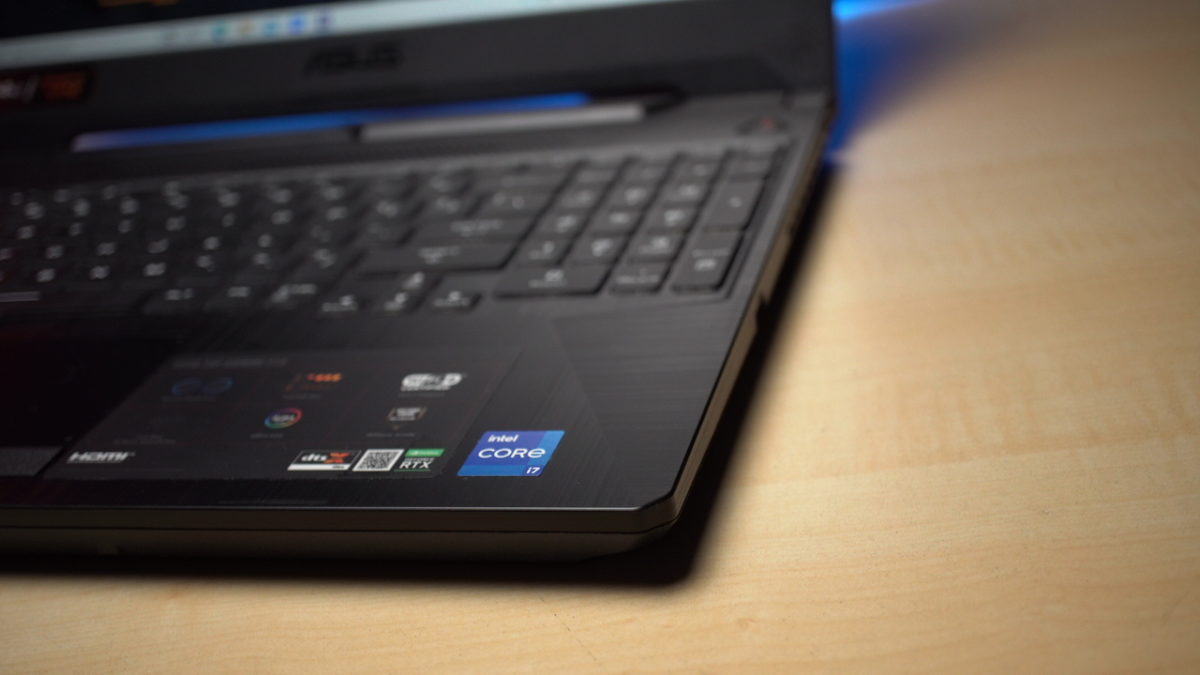
This carries over to gaming although its not as decisive, its enough to get a recommendation unlike the desktop comparison but for now, the data is indecisive for me on who is superior but as for an RTX 3060, it is close. Light-resources games likes esports titles may have increased benefits so this may please fans who like CSGO, League or Valorant although again, we’re talking about very small margins here.
At the end of the day, its not as cut and dry as AMD or Intel would want it to swing their way. Intel can’t tame their power draw yet and AMD can’t produce more laptops to satisfy the market. Intel prices their laptops a bit higher in general and AMD is surely in there to scoop those buyers not willing to fork out the full asking price, but when we’re talking about $100 or so, with people needing laptops for work, remote learning and gaming just to weather thru this pandemic, options are good but the best device is the one that’s available.
The ASUS TUF F15 retail price is ₱79,995 and is now available at Abenson, Electroworld, Gigahertz, Lazada, Octagon, PC Express, Silicon Valley and Villman.


